3 Erlang Top
3.1 Introduction
Erlang Top, etop is a tool for presenting information about erlang processes similar to the information presented by top in UNIX.
3.2 Output
The output from etop can be graphical or text based.
Text based it looks like this:
========================================================================================
 tiger@durin                                                               13:40:32
 Load:  cpu         0               Memory:  total        1997    binary         33
        procs     197                        processes       0    code          173
        runq      135                        atom         1002    ets            95

Pid            Name or Initial Func    Time    Reds  Memory    MsgQ Current Function
----------------------------------------------------------------------------------------
<127.23.0>     code_server                0   59585   78064       0 gen_server:loop/6
<127.21.0>     file_server_2              0   36380   44276       0 gen_server:loop/6
<127.2.0>      erl_prim_loader            0   27962    3740       0 erl_prim_loader:loop
<127.9.0>      kernel_sup                 0    6998    4676       0 gen_server:loop/6
<127.17.0>     net_kernel                62    6018    3136       0 gen_server:loop/6
<127.0.0>      init                       0    4156    4352       0 init:loop/1
<127.16.0>     auth                       0    1765    1264       0 gen_server:loop/6
<127.18.0>     inet_tcp_dist:accept       0     660    1416       0 prim_inet:accept0/2
<127.5.0>      application_controll       0     569    6756       0 gen_server:loop/6
<127.137.0>    net_kernel:do_spawn_       0     553    5840       0 dbg:do_relay_1/1
========================================================================================
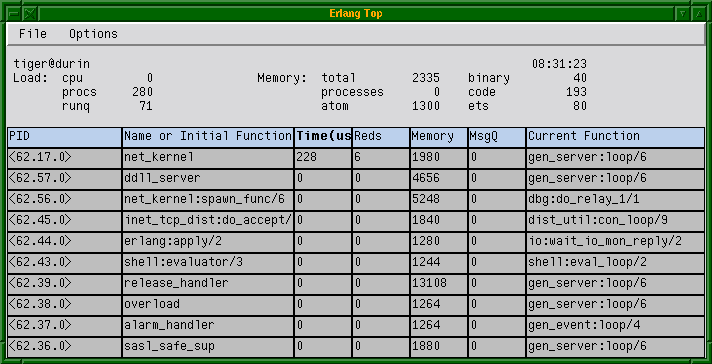
And graphically it looks like this:

Figure 3.1: Graphical presentation of etop
The header includes some system information:
- Load
- cpu is Runtime/Wallclock, i.e. the percentage of time where the node has been active, procs is the number of processes on the node, and runq is the number of processes that are ready to run.
- Memory
- This is the memory allocated by the node in kilo bytes.
For each process the following information is presented:
- Time
- This is the runtime for the process, i.e. the actual time the process has been scheduled in.
- Reds
- This is the number of reductions that has been executed on the process
- Memory
- This is the size of the process in bytes, obtained by a call to process_info(Pid,memory).
- MsgQ
- This is the length of the message queue for the process.
Time and Reds can be presented as accumulated values or as values since last update.
3.3 Start
To start etop with the graphical presentation, use the script getop or the batch file getop.bat, e.g. getop -node tiger@durin
To start etop with the text based presentation use the script etop or the batch file etop.bat, e.g. etop -node tiger@durin,
3.4 Configuration
All configuration parameters can be set at start by adding -OptName Value to the command line, e.g. etop -node tiger@durin -setcookie mycookie -lines 15.
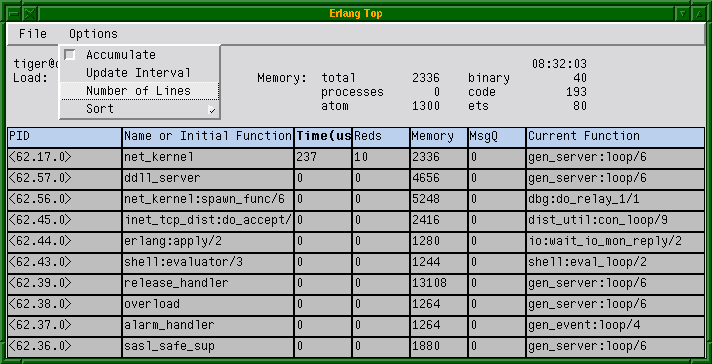
The parameters lines, interval, accumulate and sort can be changed during runtime. Use the Options menu with the graphical presentation or the function etop:config/2 with the text based presentation.
A list of all valid configuration parameters can be found in the reference manual for etop.
Note that it is even possible to change which information to sort by by clicking the header line of the table in the graphical presentation.
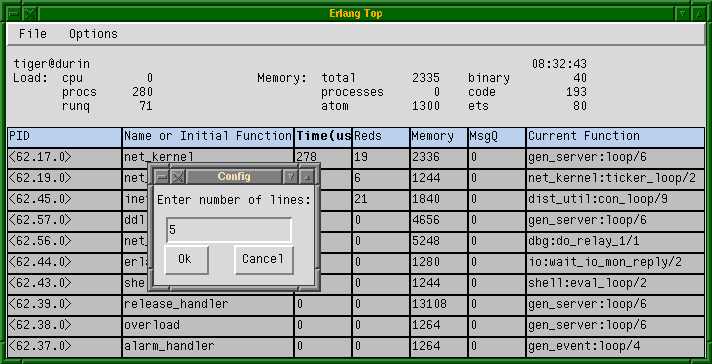
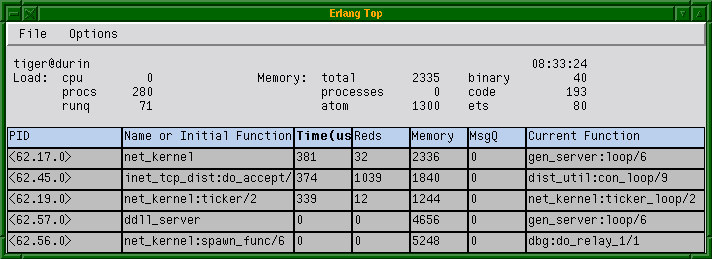
Example: Change configuration with graphical presentation

Figure 3.2: Select the option to change from the Options menu.

Figure 3.3: Enter the new value in the popup window and click "Ok"

Figure 3.4: The interface is updated with the new configuration
Example: Change configuration with text based presentation
========================================================================================
 tiger@durin                                                               10:12:39
 Load:  cpu         0               Memory:  total        1858    binary         33
        procs     191                        processes       0    code          173
        runq        2                        atom         1002    ets            95

Pid            Name or Initial Func    Time    Reds  Memory    MsgQ Current Function
----------------------------------------------------------------------------------------
<127.23.0>     code_server                0   60350   71176       0 gen_server:loop/6
<127.21.0>     file_server_2              0   36380   44276       0 gen_server:loop/6
<127.2.0>      erl_prim_loader            0   27962    3740       0 erl_prim_loader:loop
<127.17.0>     net_kernel                 0   13808    3916       0 gen_server:loop/6
<127.9.0>      kernel_sup                 0    6998    4676       0 gen_server:loop/6
<127.0.0>      init                       0    4156    4352       0 init:loop/1
<127.18.0>     inet_tcp_dist:accept       0    2196    1416       0 prim_inet:accept0/2
<127.16.0>     auth                       0    1893    1264       0 gen_server:loop/6
<127.43.0>     ddll_server                0     582    3744       0 gen_server:loop/6
<127.5.0>      application_controll       0     569    6756       0 gen_server:loop/6
========================================================================================
etop:config(lines,5).
ok
(etop@durin)2>
========================================================================================
 tiger@durin                                                               10:12:44
 Load:  cpu         0               Memory:  total        1859    binary         33
        procs     192                        processes       0    code          173
        runq        2                        atom         1002    ets            95

Pid            Name or Initial Func    Time    Reds  Memory    MsgQ Current Function
----------------------------------------------------------------------------------------
<127.17.0>     net_kernel               183      70    4092       0 gen_server:loop/6
<127.335.0>    inet_tcp_dist:do_acc     141      22    1856       0 dist_util:con_loop/9
<127.19.0>     net_kernel:ticker/2      155       6    1244       0 net_kernel:ticker1/2
<127.341.0>    net_kernel:do_spawn_       0       0    5840       0 dbg:do_relay_1/1
<127.43.0>     ddll_server                0       0    3744       0 gen_server:loop/6
========================================================================================
3.5 Print to file
At any time, the current etop display can be dumped to a text file. Use Dump to file on the File menu with the graphical presentation or the function etop:dump/1 with the text based presentation.
3.6 Stop
To stop etop, use Exit on the File menu for the graphical presentation, or the function etop:stop/0 with the text based presentation.
