1 Pman
1.1 Introduction
The process manager Pman is a tool for viewing processes executing locally or on remote nodes. Its main purpose is to locate erroneous code by inspecting the state of the processes and by tracing events. Bottlenecks, unread messages, and bad memory handling are some of the problems that can be solved with Pman.
Processes may be inspected individually in a process trace window. There the user may dynamically follow the execution of a process by getting trace output for sent and received messages as well as for called functions and some other process events. Information about source code modules executed by the processes is also accessible. Note that Pman has some effect on the real time behavior of a running system.
1.2 Getting Started with Pman
Start Pman by calling pman:start(). It will start the Main Window, showing an overview of all processes running at the current node.
To trace a certain process, select it by clicking on its line and then chose Trace->Selected Process, or simply double-click it. This will open a Trace Window. In the Trace Window, there is some information about the process and traced events are added dynamically.
Which events to trace are selected in the Options Window which is opened by choosing File->Options... in the Main Window or in a Trace Window. Currently supported trace events are message sending, message receiving, function calls and process events.
It is possible to by-pass the Main Window and open a Trace Window directly for the process Pid by calling pman:proc(Pid).
1.3 The Main Window
The Main Window shows all processes running at the displayed node. The window is automatically updated every 5 seconds. Select which node to display in the window by choosing the node name from the Nodes menu.
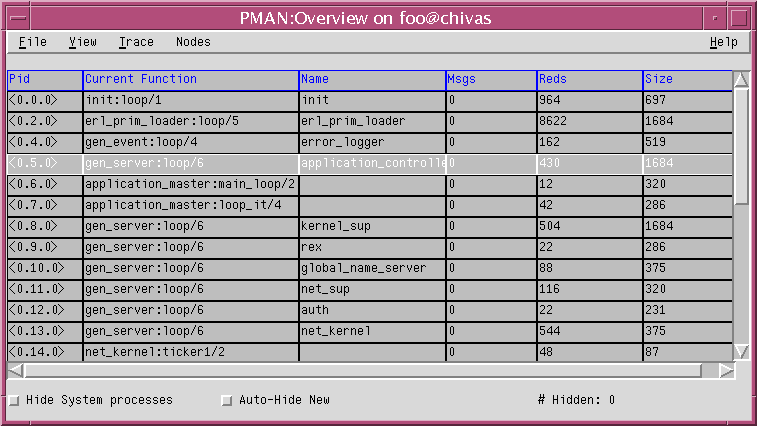
Figure 1.1: The Main Window.
A process can be selected by clicking on its line. The selected process is highlighted. Use the arrow keys to move up and down in the process overview.
The following information is displayed for each process:
- Pid - process identifier.
- Current Function - the function (Module:Function/Arity) the process is currently executing.
- Name - registered name of the process, if any.
- Msgs - number of messages in the process' mailbox.
- Reds - number of reductions performed. Gives a rough estimate of the process' work load.
- Size - estimated size of the process, in words, calculated by adding the stack size and the heap size.
At the bottom of the window the following functions and information can be found:
- Hide System Processes
- This check button controls the display of what Pman consider system processes, that is, processes Pman knows are part of Erlang/OTP rather than the user's application. If the button is selected, these system processes will not be shown.
- Auto-Hide New
- This check button controls the treatment of newly created processes. If it is selected, new processes will not be shown.
- # Hidden
- This label displays the number of processes currently executing that are not shown in the process overview.
The File Menu
- Options...
- Open the Options Window which allows the user to set the trace options to use.
- Save Options
- Save the options set using the Options Window. The options are stored to the file HOME/.erlang_tools/pman.opts, where HOME is the user's home directory, and are automatically loaded the next time Pman is started.
- Exit
- Stop Pman.
The View Menu
This menu mainly contains buttons for controlling what to display in the Main Window. Note that the View Menu overrides the settings of the check buttons (Hide System processes, Auto-Hide new) in the Main Window.
- Hide All Processes
- Hide all processes.
- Hide Modules...
- Opens a dialog window with all loaded modules. If the user selects a window and clicks OK, the process overview will not show any processes running code from those modules.
- Hide Selected Processs
- Hide the selected process.
- Module Info...
- Given a selected process currently executing a function in the module Module, this menu button opens a window showing information about the module as returned from Module:module_info().
- Refresh
- Updates the process overview.
- Show All Processes
- Show all processes, except system processes and/or new processes if Hide System Processes and/or Auto-Hide New is selected.
- Show Processes...
- Opens a dialog window with all hidden processes. If the user selects a process and clicks OK, the process overview will show that process.
The Trace Menu
- Kill
- Terminates the selected process by calling exit(Pid,kill).
- Trace Selected Process
- Opens a Trace Window for the selected process. Tracing will start immediately with the default trace flags set from the Main Window.
- Shell Process
- Opens a Trace Window for the shell process of node Pman was started at (not the displayed node). If the shell process dies, the opened Trace Window will find the pid of the automatically started new shell process, and continue to trace that process.
The Nodes Menu
The Nodes menu contains one entry for each known node. By selecting a node from the Nodes menu, the process overview window will change its view, and display the processes running on that node.
The Help Menu
- Help
- Selecting Help from the Help menu will cause the HTML version of the Pman User's Guide (this document) to be displayed. Currently this function requires Netscape to be up and running.
1.4 The Trace Window
A Trace Window outputs trace information for a traced process. A Trace Window automatically uses the trace options set in the Main Window, but it is also possible to change the options for each Trace Window individually.
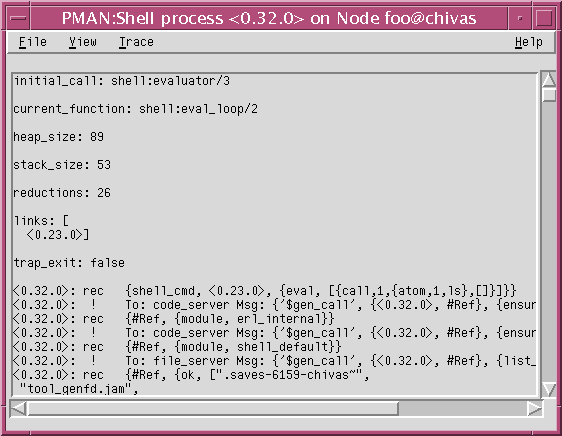
Figure 1.2: The Trace Window.
There is no limit to how many Trace Windows can be open at the same time. However, notice that if more processes are traced, the performance degradation of the system will be more noticeable.
The following information is displayed, where applicable:
- initial call - the function (Module:Function/Arity) the process started executing in.
- current function - the function (Module:Function/Arity) the process is currently executing.
- messages - the messages in the mailbox.
- dictionary - the contents of the process dictionary.
- heap size - heap size in words.
- stack size - stack size in words.
- reductions - number of reductions performed. Gives a rough estimate of the process' work load.
- links - list of pids the process is linked to.
- trap_exit - true if the process trap exit signals, false otherwise.
In the Trace Window, trace output is continuously added. First in each trace message is the pid of the traced process. Note that if the inheritance flags for tracing are set, the trace output for the spawned/linked processes will be shown in the same window as the spawning/linking process.
Each trace message also has a mnemonic tag:
- !
- This tag indicates that a message has been sent. Following the To: tag will be a pid/name of the receiver. Next, following the Msg: tag will be the sent message.
- rec
- This tag indicates that a message has been received. Following this will be the received message.
- call
- This tag indicates a call to a function. Following this will be the actual call, with all the arguments.
- link
- This tag indicates that a link between the traced process and another process has been created. Following this will be the pid of the other process.
- spawn
- This tag indicates that the traced process has spawned another process. Following this will be the pid of the spawned process.
- exit
- This tag indicates that traced process has exited. Following this will be the exit reason.
The File Menu
- Options...
- Opens the Options Window which allows the user to set the trace options to use for this specific Trace Window.
- Save Buffer...
- Opens a dialog that prompts the user for a file name to save the current Trace Window contents in.
- Close
- Stops tracing of the process, and closes the Trace Window.
The View Menu
- Clear Buffer
- Clears the contents of the Trace Window.
- Module Info
- Opens a window showing information about the module the process is currently executing code from, as returned from Module:module_info().
The Trace Menu
- All Linked Processes
- Opens a Trace Window for each of the processes linked to the process being traced in the current Trace Window.
- Linked Process ->
- The Linked Process submenu has one entry for each process linked to the process being traced in the current Trace Window. Select one of the processes to open a new Trace Window for that process.
- Kill
- Terminates the process being traced in the current Trace Window by calling exit(Pid,kill).
The Help Menu
- Help
- Selecting Help from the Help menu will cause the HTML version of the Pman User's Guide (this document) to be displayed. Currently this function requires Netscape to be up and running.
1.5 The Options Window
The Options Window allows the user to specify the amount of output, and the destination of output for traced processes.
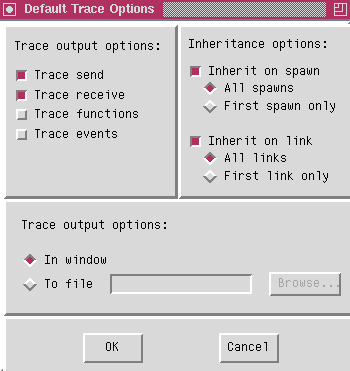
Figure 1.3: The Options Window.
In the upper left corner of the Options Window, there are check buttons for determining what to output in the Trace Window:
- Trace send
- Select this check button to display information about sent messages.
- Trace receive
- Select this check button to display information about received messages.
- Trace functions
- Select this check button to display information about function calls.
- Trace events
- Select this check button to display information about process events, such as spawn, link and exit.
In the upper right corner of the dialog, there are options for controlling the behaviour of spawned or linked processes:
- Inherit on spawn
-
The user may select if spawned processes shall also be traced. And if so, if all spawned processes should be traced, or just the first spawned process.
If a spawned process is traced, it will get the same trace options that are set for the spawning process. And the output will be shown in the same Trace Window as that of the spawning process.
.
- Inherit on link
-
The user may select if a process that is being linked to shall be traced. And if so, if all linked processes shall be traced, or just the first one linked to.
If a linked process is traced, it will get the same trace options that are set for the linking process. And the output will be shown in the same Trace Window as that of the linked process.
In the lower part of the Options Dialog, the user may select whether the trace information shall be output to a file, or appear in the trace window.
Sending trace information to a file is more efficient than displaying it in the Trace Window. Furthermore, if the amount of trace data is large, it will not be lost if tracing to a file. The trace information in the Trace Window has an upper limit (approx. 10,000 lines), after which the output buffer will be cleared.