1 Percept
Percept, or Percept - Erlang Concurrency Profiling Tool, utilizes trace informations and profiler events to form a picture of the processes's and ports runnability.
1.1 Introduction
Percept uses erlang:trace/3 and erlang:system_profile/2 to monitor events from process states. Such states are,
- waiting
- running
- runnable
- free
- exiting
There are some other states too, suspended, hibernating, and garbage collecting (gc). The only ignored state is gc and a process is considered to have its previous state through out the entire garbage collecting phase. The main reason for this, is that our model considers the gc as a third state neither active nor inactive.
A waiting or suspended process is considered an inactive process and a running or runnable process is considered an active process.
Events are collected and stored to a file. The file can be moved and analyzed on a different machine than the target machine.
Note, even if percept is not installed on your target machine, profiling can still be done via the module percept_profile located in runtime_tools.
1.2 Getting started
Profiling
There are a few ways to start the profiling of a specific code. The command percept:profile/3 is a preferred way.
The command takes a filename for the data destination file as first argument, a callback entry-point as second argument and a list of specific profiler options, for instance procs, as third argument.
Let's say we have a module called example that initializes our profiling-test and let it run under some defined manner designed by ourself. The module needs a start function, let's call it go and it takes zero arguments. The start arguments would look like:
percept:profile("test.dat", {test, go, []}, [procs]).
For a semi-real example we start a tree of processes that does sorting of random numbers. In our model below we use a controller process that distributes work to different client processes.
-module(sorter).
-export([go/3,loop/0,main/4]).

go(I,N,M) ->
    spawn(?MODULE, main, [I,N,M,self()]),
    receive done -> ok end.

main(I,N,M,Parent) ->
    Pids = lists:foldl(
	fun(_,Ps) ->
	    [ spawn(?MODULE,loop, []) | Ps]
	end, [], lists:seq(1,M)),

    lists:foreach(
	fun(_) ->
	    send_work(N,Pids),
	    gather(Pids)
	end, lists:seq(1,I)),

    lists:foreach(
	fun(Pid) ->
	    Pid ! {self(), quit}
	end, Pids),

    gather(Pids), Parent ! done.

send_work(_,[]) -> ok;
send_work(N,[Pid|Pids]) ->
    Pid ! {self(),sort,N},
    send_work(round(N*1.2),Pids).

loop() ->
    receive
	{Pid, sort, N} -> dummy_sort(N),Pid ! {self(), done},loop();
	{Pid, quit} -> Pid ! {self(), done}
    end.

dummy_sort(N) -> lists:sort([ random:uniform(N) || _ <- lists:seq(1,N)]).

gather([]) -> ok;
gather([Pid|Pids]) -> receive {Pid, done} -> gather(Pids) end.
We can now start our test using percept:
Erlang (BEAM) emulator version 5.6 [async-threads:0] [kernel-poll:false]

Eshell V5.6  (abort with ^G)
1> percept:profile("test.dat", {sorter, go, [5, 2000, 15]}, [procs]).
Starting profiling.
ok
Percept sets up the trace and profiling facilities to listen for process specific events. It then stores these events to the test.dat file. The profiling will go on for the whole duration until sorter:go/3 returns and the profiling has concluded.
Data viewing
To analyze this file, use percept:analyze("test.dat"). We can do this on any machine with Percept installed. The command will parse the data file and insert all events in a RAM database, percept_db. The initial command will only prompt how many processes were involved in the profile.
2> percept:analyze("test.dat").
Parsing: "test.dat"
Parsed 428 entries in 3.81310e-2 s.
    17 created processes.
    0 opened ports.
ok
To view the data we start the web-server using percept:start_webserver/1. The command will return the hostname and the a port where we should direct our favorite web browser.
3> percept:start_webserver(8888).
{started,"durin",8888}
4>
Overview selection
Now we can view our data. The database has its content from percept:analyze/1 command and the webserver is started.
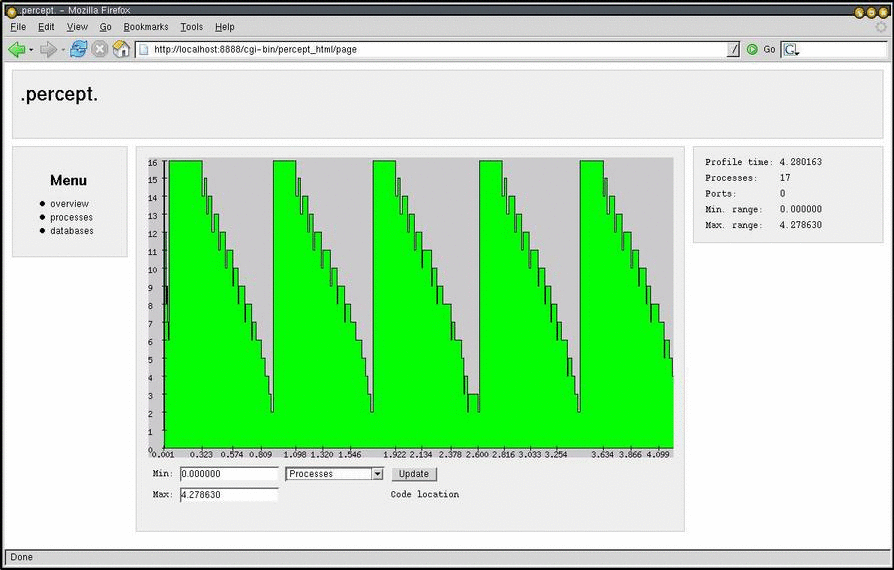
When we click on the overview button in the menu percept will generate a graph of the concurrency and send it to our web browser. In this view we get no details but rather the big picture. We can see if our processes behave in an inefficient manner. Dips in the graph represents low concurrency in the erlang system.
We can zoom in on different areas of the graph either using the mouse to select an area or by specifying min and max ranges in the edit boxes.
Measured time is presented in seconds if nothing else is stated.

Figure 1.1: Overview selection
Processes selection
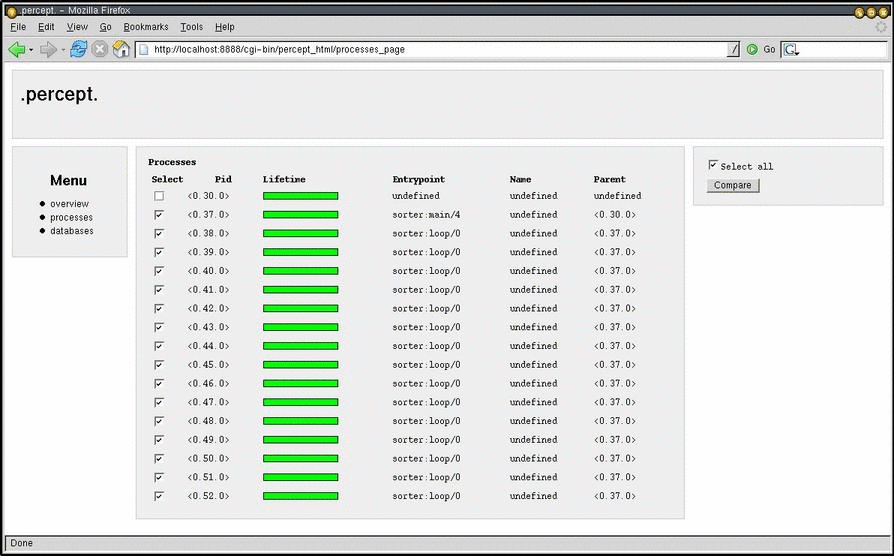
To get a more detailed description we can select the process view by clicking the processes button in the menu.
The table shows process id's that are click-able and direct you to the process information page, a lifetime bar that presents a rough estimate in green color about when the process was alive during profiling, an entry-point, its registered name if it had one and the process's parent id.
We can select which processes we want to compare and then hit the compare button on the top right of the screen.

Figure 1.2: Processes selection
Compare selection
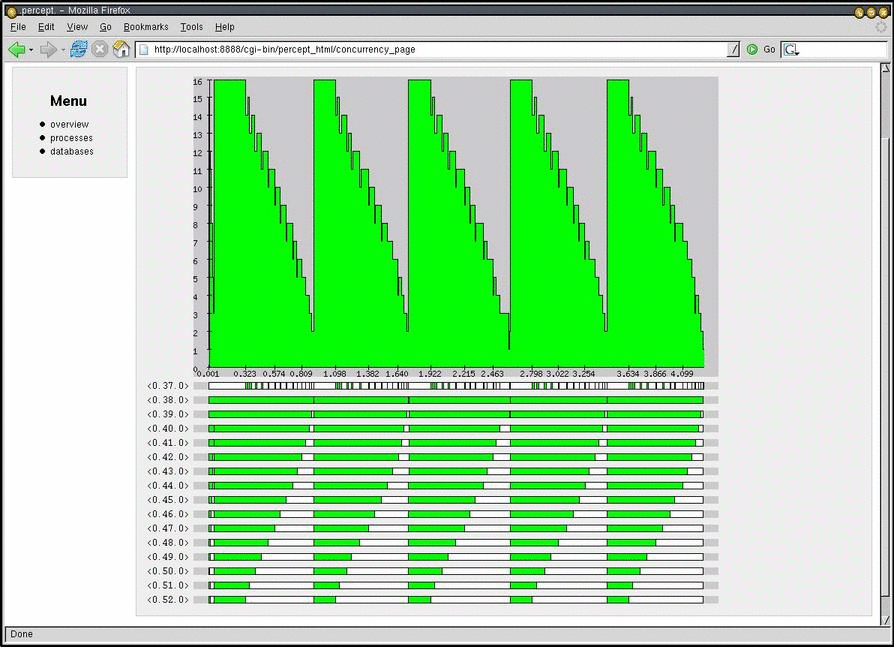
The activity bar under the concurrency graph shows each process's runnability. The color green shows when a process is active (which is running or runnable) and the white color represents time when a process is inactive (waiting in a receive or is suspended).
To inspect a certain process click on the process id button, this will direct you to a process information page for that specific process.

Figure 1.3: Processes compare selection
Process information selection
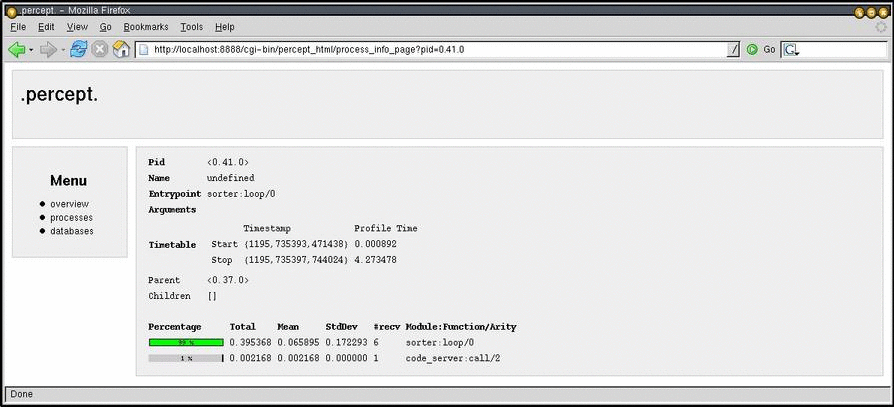
Here we can some general information for the process. Parent and children processes, spawn and exit times, entry-point and start arguments.
We can also see the process' inactive times. How many times it has been waiting, statistical information and most importantly in which function.
The time percentages presented in process information are of time spent in waiting, not total run time.

Figure 1.4: Process information selection
