2 Tutorial
2.1 Visualizing Message Sequence Charts
The easiest way of using ET, is to just use it as a graphical tool for displaying message sequence charts. In order to do that you need to first start a Viewer (which by default starts a Collector):
      {ok, ViewerPid} = et_viewer:start([{title,"Coffee Order"}]),
      CollectorPid = et_viewer:get_collector_pid(ViewerPid).
Then you send events to the Collector with the function et_collector:report_event/6 like this:
et_collector:report_event(CollectorPid,85,from,to,message,extra_stuff).The Viewer will automatically pull events from the Collector and display them on the screen.
The number (in this case 85) is an integer from 1 to 100 that specifies the "detail level" of the message. The higher the number, the more important it is. This provides a crude form of priority filtering.
The from, to, and message parameters are exactly what they sound like. from and to are visualized in the Viewer as "lifelines", with the message passing from one to the other. If from and to are the same value, then it is displayed next to the lifeline as an "action". The extra_stuff value is simply data that you can attach that will be displayed when someone actually clicks on the action or message in the Viewer window.
The module et/examples/et_display_demo.erl illustrates how it can be used:
-module(et_display_demo).

-export([test/0]).

test() ->
    {ok, Viewer} = et_viewer:start([{title,"Coffee Order"}, {max_actors,10}]),
    Drink = {drink,iced_chai_latte},
    Size = {size,grande},
    Milk = {milk,whole},
    Flavor = {flavor,vanilla},
    C = et_viewer:get_collector_pid(Viewer),
    et_collector:report_event(C,99,customer,barrista1,place_order,[Drink,Size,Milk,Flavor]),
    et_collector:report_event(C,80,barrista1,register,enter_order,[Drink,Size,Flavor]),
    et_collector:report_event(C,80,register,barrista1,give_total,"$5"),
    et_collector:report_event(C,80,barrista1,barrista1,get_cup,[Drink,Size]),
    et_collector:report_event(C,80,barrista1,barrista2,give_cup,[]),
    et_collector:report_event(C,90,barrista1,customer,request_money,"$5"),
    et_collector:report_event(C,90,customer,barrista1,pay_money,"$5"),
    et_collector:report_event(C,80,barrista2,barrista2,get_chai_mix,[]),
    et_collector:report_event(C,80,barrista2,barrista2,add_flavor,[Flavor]),
    et_collector:report_event(C,80,barrista2,barrista2,add_milk,[Milk]),
    et_collector:report_event(C,80,barrista2,barrista2,add_ice,[]),
    et_collector:report_event(C,80,barrista2,barrista2,swirl,[]),
    et_collector:report_event(C,80,barrista2,customer,give_tasty_beverage,[Drink,Size]),
    ok.
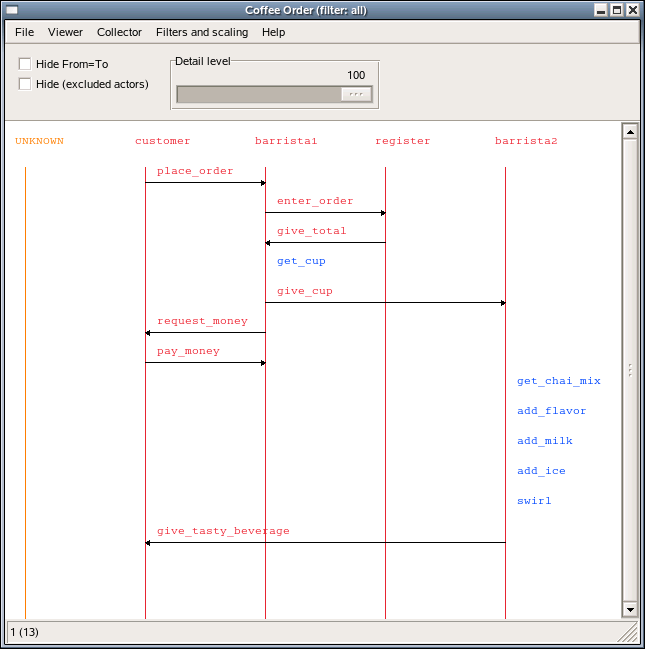
When you run the et_display_demo:test(). function in the example above, the Viewer window will look like this:
.
Figure 2.1: Screenshot of the Viewer window
2.2 Four Modules
The event tracer framework is made up of four modules:
et
et_collector
et_viewer
et_selector
In addition, you'll probably want to familiarize yourself with the dbg module and possibly seq_trace module as well.
2.3 The Event Tracer Interface
The et module is not like other modules. It contains a function called et:trace_me/5. Which is a function that does not do any useful stuff at all. Its sole purpose is to be a function that is easy to trace. A call to it may be something like:
et:trace_me(85,from,to,message,extra_stuff).The parameters to et:trace_me/5 are the same as to et_collector:report_event/6 in the previous chapter. The big difference between the two is in the semantics of the two functions. The second actually reports an Event to the Collector while the first does nothing, it just returns the atom hopefully_traced. In order to make the parameters to et:trace_me/5 turn up in the Collector, tracing of that function must be activated and the Collector must be registered as a Tracer of the Raw Trace Data.
Erlang tracing is a seething pile of pain that involves reasonably complex knowledge of clever ports, tracing return formats, and specialized tracing MatchSpecs (which are really their own special kind of hell). The tracing mechanism is very powerful indeed, but it can be hard to grasp.
Luckily there is a simplified way to start tracing of et:trace_me/5 function calls. The idea is that you should instrument your code with calls to et:trace_me/5 in strategic places where you have interesting information available in your program. Then you just start the Collector with global tracing enabled:
et_viewer:start([{trace_global, true}, {trace_pattern, {et,max}}]).This will start a Collector, a Viewer and also start the tracing of et:trace_me/5 function calls. The Raw Trace Data is collected by the Collector and a view of it is displayed on the screen by the Viewer. You can define your own "views" of the data by implementing your own Filter functions and register them in the Viewer.
2.4 The Collector and Viewer
These two pieces work in concert. Basically, the Collector receives Raw Trace Data and processes it into Events in a et specific format (defined in et/include/et.hrl). The Viewer interrogates the Collector and displays an interactive representation of the data.
You might wonder why these aren't just one module. The Collector is a generic full-fledged framework that allows processes to "subscribe" to the Events that it collects. One Collector can serve several Viewers. The typical case is that you have one Viewer that visualizes Events in one flavor and another Viewer that visualizes them in another flavor. If you for example are tracing a text based protocol like HTML (or Megaco/H.248) it would be useful to be able to display the Events as plain text as well as the internal representation of the message. The architecture does also allow you to implement your own Viewer program as long as it complies to the protocol between the Collector/Viewer protocol. Currently two kinds of Viewers exists. That is the old GS based one and the new based on wxWidgets. But if you feel for it you may implement your own Viewer, which for example could display the Events as ASCII art or whatever you feel useful.
The Viewer will by default create a Collector for you. With a few options and some configuration settings you can start collecting Events.
The Collector API does also allow you to save the collected Events to file and later load them in a later session.
2.5 The Selector
This is perhaps the most central module in the entirety of the et suite. The Collector needs "filters" to convert the Raw Trace Data into "events" that it can display. The et_selector module provides the default Filter and some API calls to manage the Trace Pattern. The Selector provides various functions that achieve the following:
Convert Raw Trace Data into an appropriate Event
Magically notice traces of the et:trace_me/5 function and make appropriate Events
Carefully prevent translating the Raw Trace Data twice
Manage a Trace Pattern
The Trace Pattern is basically a tuple of a module and a detail level (either an integer or the atom max for full detail). In most cases the Trace Pattern {et,max} does suffice. But if you do not want any runtime dependency of et you can implement your own trace_me/5 function in some module and refer to that module in the Trace Pattern.
The specified module flows from your instantiation of the Viewer, to the Collector that it automatically creates, gets stashed in as the Trace Pattern, and eventually goes down into the bowels of the Selector.
The module that you specify gets passed down (eventually) into Selector's default Filter. The format of the et:trace_me/5 function call is hardcoded in that Filter.
2.6 How To Put It Together
The Collector automatically registers itself to listen for trace Events, so all you have to do is enable them.
For those people who want to do general tracing, consult the dbg module on how to trace whatever you're interested in and let it work its magic. If you just want et:trace_me/5 to work, do the following:
Create a Collector
Create a Viewer (this can do step #1 for you)
Turn on and pare down debugging
The module et/examples/et_trace_demo.erl achieves this.
-module(et_trace_demo).

-export([test/0]).

test() ->
    et_viewer:start([
        {title,"Coffee Order"},
        {trace_global,true},
        {trace_pattern,{et,max}},
        {max_actors,10}
      ]),
      %% dbg:p(all,call),
      %% dbg:tpl(et, trace_me, 5, []),
      Drink = {drink,iced_chai_latte},
      Size = {size,grande},
      Milk = {milk,whole},
      Flavor = {flavor,vanilla},
      et:trace_me(99,customer,barrista1,place_order,[Drink,Size,Milk,Flavor]),
      et:trace_me(80,barrista1,register,enter_order,[Drink,Size,Flavor]),
      et:trace_me(80,register,barrista1,give_total,"$5"),
      et:trace_me(80,barrista1,barrista1,get_cup,[Drink,Size]),
      et:trace_me(80,barrista1,barrista2,give_cup,[]),
      et:trace_me(90,barrista1,customer,request_money,"$5"),
      et:trace_me(90,customer,barrista1,pay_money,"$5"),
      et:trace_me(80,barrista2,barrista2,get_chai_mix,[]),
      et:trace_me(80,barrista2,barrista2,add_flavor,[Flavor]),
      et:trace_me(80,barrista2,barrista2,add_milk,[Milk]),
      et:trace_me(80,barrista2,barrista2,add_ice,[]),
      et:trace_me(80,barrista2,barrista2,swirl,[]),
      et:trace_me(80,barrista2,customer,give_tasty_beverage,[Drink,Size]),
      ok.
Running through the above, the most important points are:
Turn on global tracing
Set a Trace Pattern
Tell dbg to trace function Calls
Tell it specifically to trace the et:trace_me/5 function
When you run the et_trace_demo:test() function above, the Viewer window will look like this screenshot:
.
Figure 2.2: Screenshot of the Viewer window
